Building a Data Visualization Dashboard with React and D3.js
Published at Feb 21, 2025
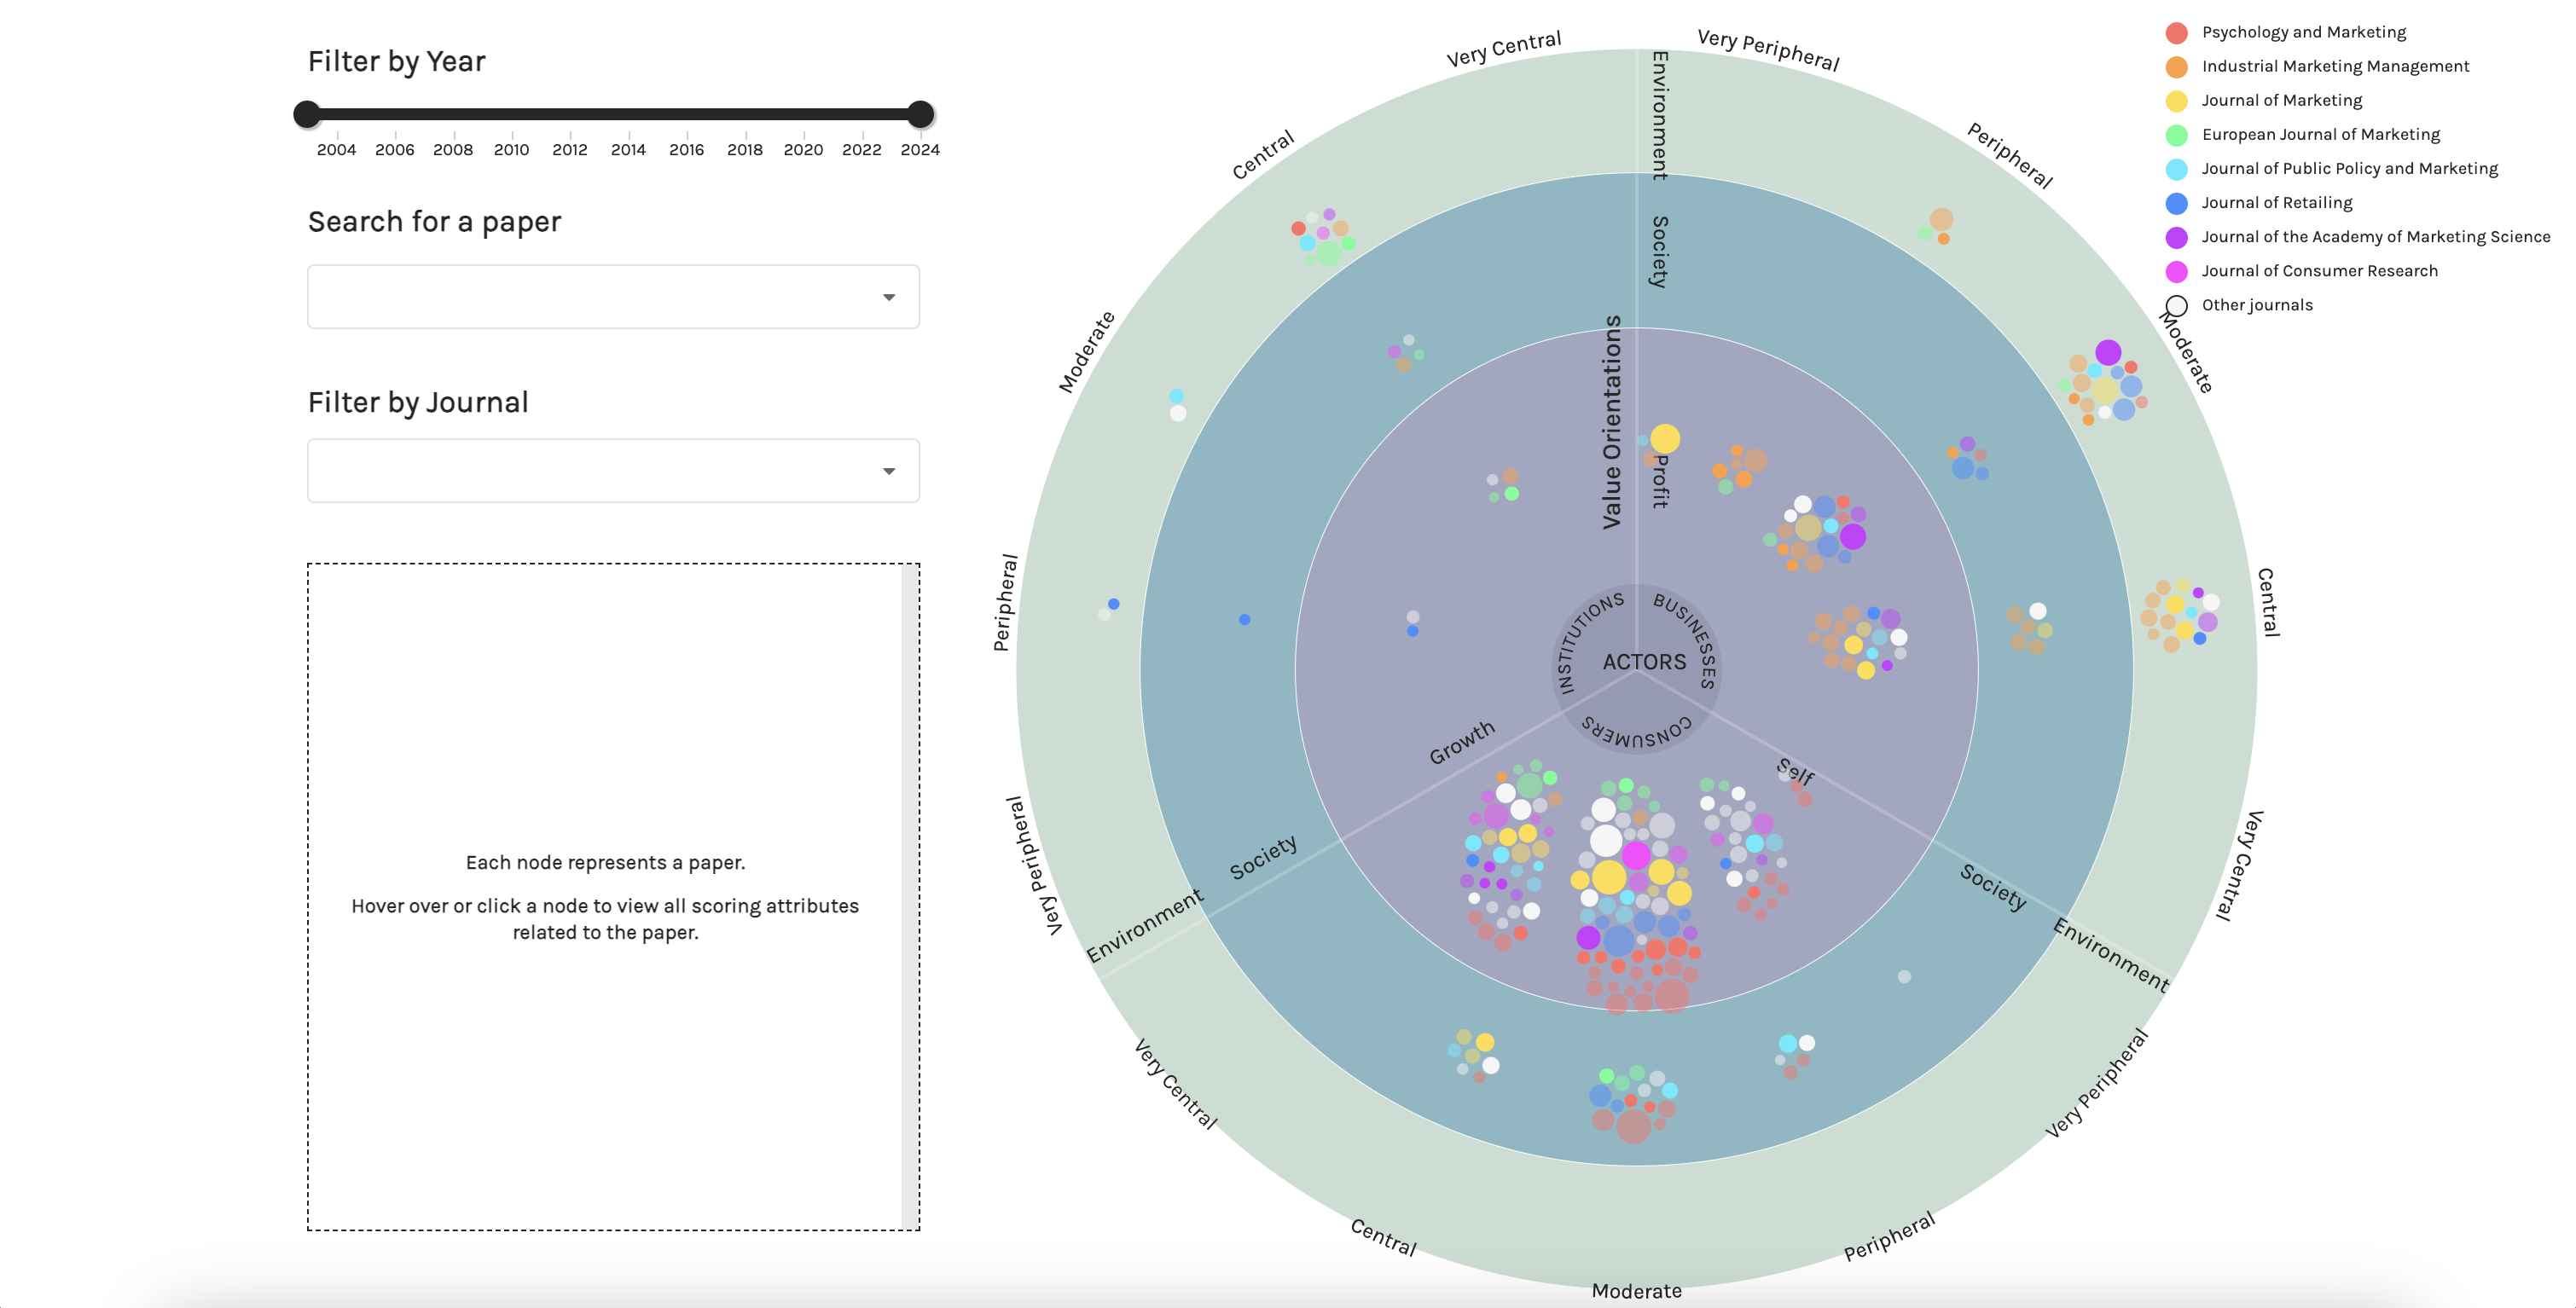
In this post, we’ll explore the implementation of an interactive React dashboard that visualizes data of hundreds of research papers. This dashboard demonstrates several React patterns and best practices that you can apply to your own projects.
The Big Picture
The dashboard has the following key features:
- Radar scatter plot visualization
- Allows users to filter papers by year range using a slider
- Provides journal filtering through a dropdown menu
- Implements paper search functionality
- Enables users to select and focus on specific papers
- Tabular data display
- Responsive tooltip system
The dashboard has the following React components, in hierarchical order:
MainPage Component
The MainPage component is responsible for data management:
- Fetches research paper data from an API
- Manages multiple states like loading, filtering, and search
- Sends the transformed and filtered data to RadarScatter component
It also renders UI components like a slider, dropdown and table.
const MainPage = () => {
  const {
    dataAll,
    setData,
    search,
    setSearch,
    loading,
    setLoading,
    filters,
    setFilters,
    controlsDisabled,
    setControlsDisabled
  } = useMainPageState();

  const processedData = useProcessedData(dataAll, filters, search);
  const memoizedJournals = useMemo(() => dataAll.journals, [dataAll.journals]);

  // Initialize year range from data
  useEffect(() => {
    if (dataAll.data?.length && !filters.years.length) {
      const [minYear, maxYear] = calculateYearRange(dataAll.data);
      setFilters(prev => ({
        ...prev,
        years: [minYear, maxYear]
      }));
    }
  }, [dataAll.data]);

  // Handlers
  const handleYearChange = useCallback((lower, upper) => {
    setFilters(prev => ({
      ...prev,
      years: [lower, upper]
    }));
  }, []);

  const handleJournalChange = useCallback((_, { value }) => {
    setFilters(prev => ({
      ...prev,
      journals: value
    }));
  }, []);

  const handleSearchChange = useCallback(
    _.debounce((_, { value }) => {
      setSearch({
        value
      });

      // Reset node selection when search is cleared
      if (!value) {
        setControlsDisabled(false);
      }
    }, 300),

    [controlsDisabled]
  );

  const handleNodeClick = useCallback((isSelected) => {
    setControlsDisabled(isSelected); // Disable dropdown and timeslider when a node is clicked
  }, []);

  // Data fetching
  useEffect(() => {
    const fetchData = async () => {
      try {
        const response = await fetch(`${process.env.REACT_APP_API_URL}/api/data`);
        if (!response.ok) throw new Error(`HTTP error! status: ${response.status}`);

        const result = await response.json();
        if (!result.papers || !result.scores) {
          throw new Error('Invalid data structure');
        }

        const transformedData = transformData(
          result.scores,
          result.papers
        );

        setData(transformedData);
      } catch (error) {
        console.error('Data fetch failed:', error);
      } finally {
        setLoading(false);
      }
    };

    fetchData();
  }, []);

  // Dropdown menu items for Journals
  const journalOptions = useMemo(() => (
    dataAll.data
      ?.map(d => d.sourcetitle)
      .filter(onlyUnique)
      .map(d => ({
        key: d,
        text: d,
        value: d
      }))
      .sort((a, b) => d3.ascending(a.key, b.key))
  ), [dataAll.data]);

  // Dropdown menu items for Papers
  const searchOptions = useMemo(() => {
    if (!dataAll.data?.length || !filters.years.length) {
      return [];
    }
    // Narrow down searchable papers based on filters
    return calculateSearchOptions(dataAll.data, filters);
  }, [dataAll.data, filters]);

  if (loading) {
    return (
      <h1>Loading...</h1>
    )
  }

  if (!processedData.length) {
    return null;
  }

  return (
    <TooltipProvider>
      <Header />
      <div className="App__wrapper">
        <div className='App_container'>
          <div className='SideBarLeft'>
            <Slider
              changeThresholds={handleYearChange}
              active={!controlsDisabled}
              range={calculateYearRange(dataAll.data)}
              value={filters.years}
            />
            <div className="Search">
              <h3>Search for a paper</h3>
              <Dropdown
                placeholder=''
                fluid
                search
                selection
                clearable
                options={searchOptions}
                onChange={handleSearchChange}
                value={search.value}
                disabled={controlsDisabled}
              />
            </div>
            <div className="Search">
              <h3>
                Filter by Journal
              </h3>
              <Dropdown
                placeholder=''
                fluid
                multiple
                search
                selection
                options={journalOptions}
                onChange={handleJournalChange}
                value={filters.journals}
                disabled={controlsDisabled || !!search.value}
              />
            </div>
            <Table data={processedData} search={search} />
          </div>

          <div className='Main'>
            <RadarScatter
              data={processedData}
              search={search}
              journals={memoizedJournals}
              onNodeClick={handleNodeClick}
            />
          </div>
        </div>
      </div>
    </TooltipProvider>
  );
};
Custom Hook Pattern
One of the patterns used in this component is the separation of concerns using custom hooks, such as useMainPageState.
Code Organization and Readability
- Even without reuse, the hook separates state management logic from the component’s rendering logic
- This makes the MainPage component cleaner and more focused on its layout and composition
- Instead of seeing so many useState declarations at the top of MainPage, you get one clear hook call
Maintenance and Documentation
- The hook acts as a form of self-documentation - it clearly shows all the state that the page needs
- When another developer needs to modify the state, they have one clear place to look
- It’s easier to see state dependencies when they’re grouped together
- 1 Main Data State (dataAll)
- data: Main array holding the processed paper data
- journals: List of all available journals
- This state is populated after the initial API fetch
- 2 Search State
- value: The current search term entered by user
- 3 Loading State
- Simple boolean for tracking initial data loading. Starts as true and switches to false after initial data fetch.
- Controls whether to show loading screen or main content
- 4 Filter State
- years: Array containing [minYear, maxYear] for year range filter
- journals: Array of selected journal names for filtering
- Used to filter the visualization
- 5 Controls State
- Single boolean to track if timeslider and dropdown menus should be disabled, to prevent filter changes while examining specific data
- Set to true when a node is selected (clicked) in the visualization
- 6 The hook then returns an object with all state variables and their setters, making them available to the main component.
Data Processing with useMemo
useMemo caches the processed data, ensuring that expensive data transformations only occur when dependencies change, not on every render. This prevents unnecessary processing on every render.
useProcessedData is triggered on initial data load, after search for a paper or after filtering by year or journal.
- 1 Combines multiple filter conditions
- Year range filtering
- Journal filtering
- Search filtering
- Uses boolean flags to track active filters
- 2 Adjusts entity attributes based on filter matches, for visual emphasis through opacity changes, handled by Nodes component.
Event Handlers with useCallback
Why use useCallback here? There are several reasons:
Debounce Stability
- Without useCallback, a new debounced function would be created on every render
- Each new function would have its own debounce timer. This could lead to unpredictable behavior and memory leaks
Reference Stability
- The callback is passed to a Dropdown component
- Stable references help prevent unnecessary re-renders of child components
Dependency Management
- useCallback ensures the function only recreates when this dependency changes
const handleSearchChange = useCallback(
    _.debounce((_, { value }) => {
      setSearch({
        value
      });

      // When search is cleared, enable interaction with journal dropdown again
      if (!value) {
        setControlsDisabled(false);
      }
    }, 300),
    []
);
handleSearchChange is triggered whenever a user searches for a paper and selects a value from the dropdown.
The debounce wrapper ensures the search only triggers 300ms after the user stops typing. This prevents excessive state updates while the user is still typing.
Connection to RadarScatter component
When any of these dependencies (dataAll.data, filters, search) change:
- React detects the change because they’re listed in the dependency array
- This triggers useMemo to recalculate because its dependencies changed
useProcessedDataruns again to create newprocessedData
const processedData = useProcessedData(dataAll, filters, search);
processedData is passed to RadarScatter component, which further transforms it into radial coordinates for the visualization. Finally, the transformed data is rendered through the Nodes component
  <RadarScatter
    data={processedData}
    search={search}
    journals={memoizedJournals}
    onNodeClick={handleNodeClick}
  />
RadarScatter component
This component contains a data transformation pipeline to transform data of research papers into the final format needed for visualization by the Node component. It also renders pheripheral components like the chat axis, labels, and radial background.
You may view the full RadarScatter component code here
- 1 Window Resize Handling
- Updates dimensions state with debouncing for smooth performance
- Maintains responsive layout across different screen sizes
- Cleans up event listeners on component unmount, to prevent it from holding references to functions, data, and DOM elements even though the component that created them is gone, hindering them from being garbage collected.
- 2 Node Position Calculation
- Transforms data into radial coordinates
- Memoizes calculated values to avoid expensive recalculations on every render
- Caches results to prevent unnecessary recalculations. New node positions are only computed when certain data properties or window dimensions change.
- 3 Data Preparation for Visualization
- Combines computed node positions with original data attributes
- Ensures data is in the correct and final format for the visualization layer
- 4 Accessor Function Configuration
- Defines consistent methods for accessing node properties (position, color, size)
- Handles data mapping for visual attributes like fill colors and opacity, establishing the interface between data and rendering in Nodes component
Nodes component
The Nodes component renders interactive circular nodes in an SVG, complete with hover effects, click interactions, and tooltip. It is particularly useful for network graphs, scatter plots, or any visualization requiring interactive circular elements.
These are the following interactive features:
- On mouseover of a node, it and related nodes sharing the same paper ID are highlighted. A tooltip containing information of the node is shown. Mouseout will revert the action and hide the tooltip.
- Clicking on a node will maintain the mouseover action, whilst preventing mouseout action from happening. Clicking the same node again will revert the action.
- On filtering of data through the slider or dropdown, these filtered entities are highlighted and interactive. All other non-highlighted nodes have no interactivity. On cancellation of the filtered state, then all entities are interactivity again.
- Time slider and dropdown menus are disabled after a node is clicked.
In this component, you will see useMemo, useCallback and useRef in action.
- 1 nodesRef
- This ref holds a reference to the actual SVG group element (<g>) in the DOM
- It's crucial for D3 integration because it provides the entry point for D3 to manipulate the DOM
- Using a ref here instead of querying the DOM (like document.querySelector) ensures we're always working with the correct element. The ref persists across re-renders while maintaining the same reference to the DOM element
- 2 selectedNodeRef
- Tracks which node is currently selected by storing the entity ID of the selected node, influencing event handlers.
- Using useRef instead of useState here is a key optimization because we don't want to trigger re-renders when selection changes as the selection state is only used for internal logic (highlighting and tooltip behavior)
- 3 nodesSelectionRef
- Holds the D3 selection object for the nodes container
- Persists the D3 selection across renders to avoid recreating it
- Enables efficient updates to node properties without re-selecting elements
- 4 Event Handlers
- Event handlers are encapsulated in a single useMemo function as they share the same set of dependencies.
- Reduces the number of memoized values React needs to track with a single memory allocation for all handlers
- 5 Click event
- If there are filters in place, only filtered nodes can be interacted with. Hence, the need to set an 'interactive' flag to decide whether or not to ignore the click event
- Checks if this node was already selected through a prior click event, and manages selection state and actions accordingly.
- Parent component (MainPage) is notified of selection change via `onNodeClick` callback, enabling or disabling the dropdown menus and timeslider.
- 6 Mouseover event
- If the mouse cursor is over a node, highlights related nodes using `highlightRelatedNodes` and shows the tooltip.
- It has special behavior when a node is selected: If there is a selected node (selectedNodeRef.current) and this is not that node (d.entity !== selectedNodeRef.current), then the hover is ignored.
- 7 Mouseout event
- Mouse out action is ignored for a selected (clicked) node.
- When the mouse cursor leaves the node, resets all nodes to their default opacity and hides the tooltip.
Key Differences between useCallback and useMemo
What they memoize:
useCallbackmemoizes a function definitionuseMemomemoizes the result of calling a functionReturn value:
useCallback(fn, deps)returns the function fn itselfuseMemo(() => value, deps)returns the value returned by the callbackUse cases:
useCallbackis for function stability (reference equality)useMemois for value computation optimizationThey both accept dependency arrays and only recompute when dependencies change.
Conclusion
These React components have evolved through multiple iterations. I originally built this dashboard nearly two years ago for a client and was later asked to update it with a new dataset. Revisiting the code, I took the opportunity to conduct a full review and refactor, applying the skills I’ve since gained in React. You can compare the updated code with the original.
This article showcases integration of React and D3, demonstrating best practices for building interactive data visualizations. It provides a solid foundation for building complex node-based visualizations while maintaining good performance and code maintainability.