Building an OOP-oriented data dashboard
Published at Aug 3, 2024
Using Object-Oriented Programming (OOP) concepts in JavaScript for building a data dashboard offers several advantages, especially for a complex application involving multiple charts.
Here are the key reasons why OOP is beneficial in this context:
Modularity
Encapsulation:
- Encapsulation means bundling the data (properties) and the methods (functions) that operate on the data within a single unit (class).
- Example: Each chart can be an instance of a class with its own properties and methods, encapsulating all the functionalities related to that specific chart.
Reusability
Class Inheritance:
- Inheritance allows a class to inherit properties and methods from another class.
- Example: A base Chart class can be extended by specific types of charts (e.g., BarChart, LineChart), reusing common functionalities while allowing customization.
Maintainability
Single Responsibility Principle (SRP):
- By adhering to SRP, each class has a single responsibility, making the codebase easier to maintain and extend.
- Example: Separate classes for data loading (ChartDataLoader), event handling (EventDispatcher), and rendering (GraphView) ensure that changes in one part of the application do not affect others.
Scalability
Complexity Management:
- As data dashboards often need to handle a variety of charts and dynamic data updates, OOP helps manage this complexity through well-defined class structures and interactions.
- Example: A ChartContext class can manage the state and configuration of multiple charts, making it easier to scale the application by adding new chart types or data sources.
Flexibility
Polymorphism:
- Polymorphism allows objects of different classes to be treated as objects of a common super class. This is particularly useful for operations that can be applied to multiple types of charts.
- Example: A method to update the chart view can be written in a way that it applies to any type of chart, whether it’s a bar chart or a line chart, as long as they inherit from a common Chart class.
Readability and Collaboration
Clear Structure and Documentation:
- OOP promotes a clear and logical structure, making the code more readable and easier for teams to collaborate on.
- Example: Using descriptive class names and methods (e.g., addChild, removeChild, updateView) makes the purpose of each part of the code evident, facilitating better communication among developers.
Specific Importance for a Data Dashboard with Many Charts
Consistency:
- Ensuring a consistent look and feel across multiple charts is easier when they share a common base class or set of methods.
- Example: All charts can inherit common styling and interaction methods from a parent Chart class.
Dynamic Data Handling:
- Data dashboards often require frequent updates and interactions. OOP makes it easier to handle dynamic data updates efficiently.
- Example: A ChartDataLoader class can be responsible for fetching and updating data, ensuring that all charts update consistently when data changes.
Interactivity and Events:
- Complex dashboards require handling numerous user interactions (e.g., clicks, hover events). Using an event-driven approach with an EventDispatcher class helps manage these interactions systematically.
- Example: Each chart can register event listeners for user interactions, ensuring that events are handled in a structured manner.
Modular Development:
- Large dashboards benefit from a modular approach where different developers can work on different chart types or components simultaneously without conflicts.
- Example: One developer can work on a BarChart class while another works on a LineChart class, both extending a common Chart class.
By leveraging OOP principles, you can create a data dashboard that is not only robust and maintainable but also scalable and flexible enough to accommodate future requirements and enhancements
App Flowchart
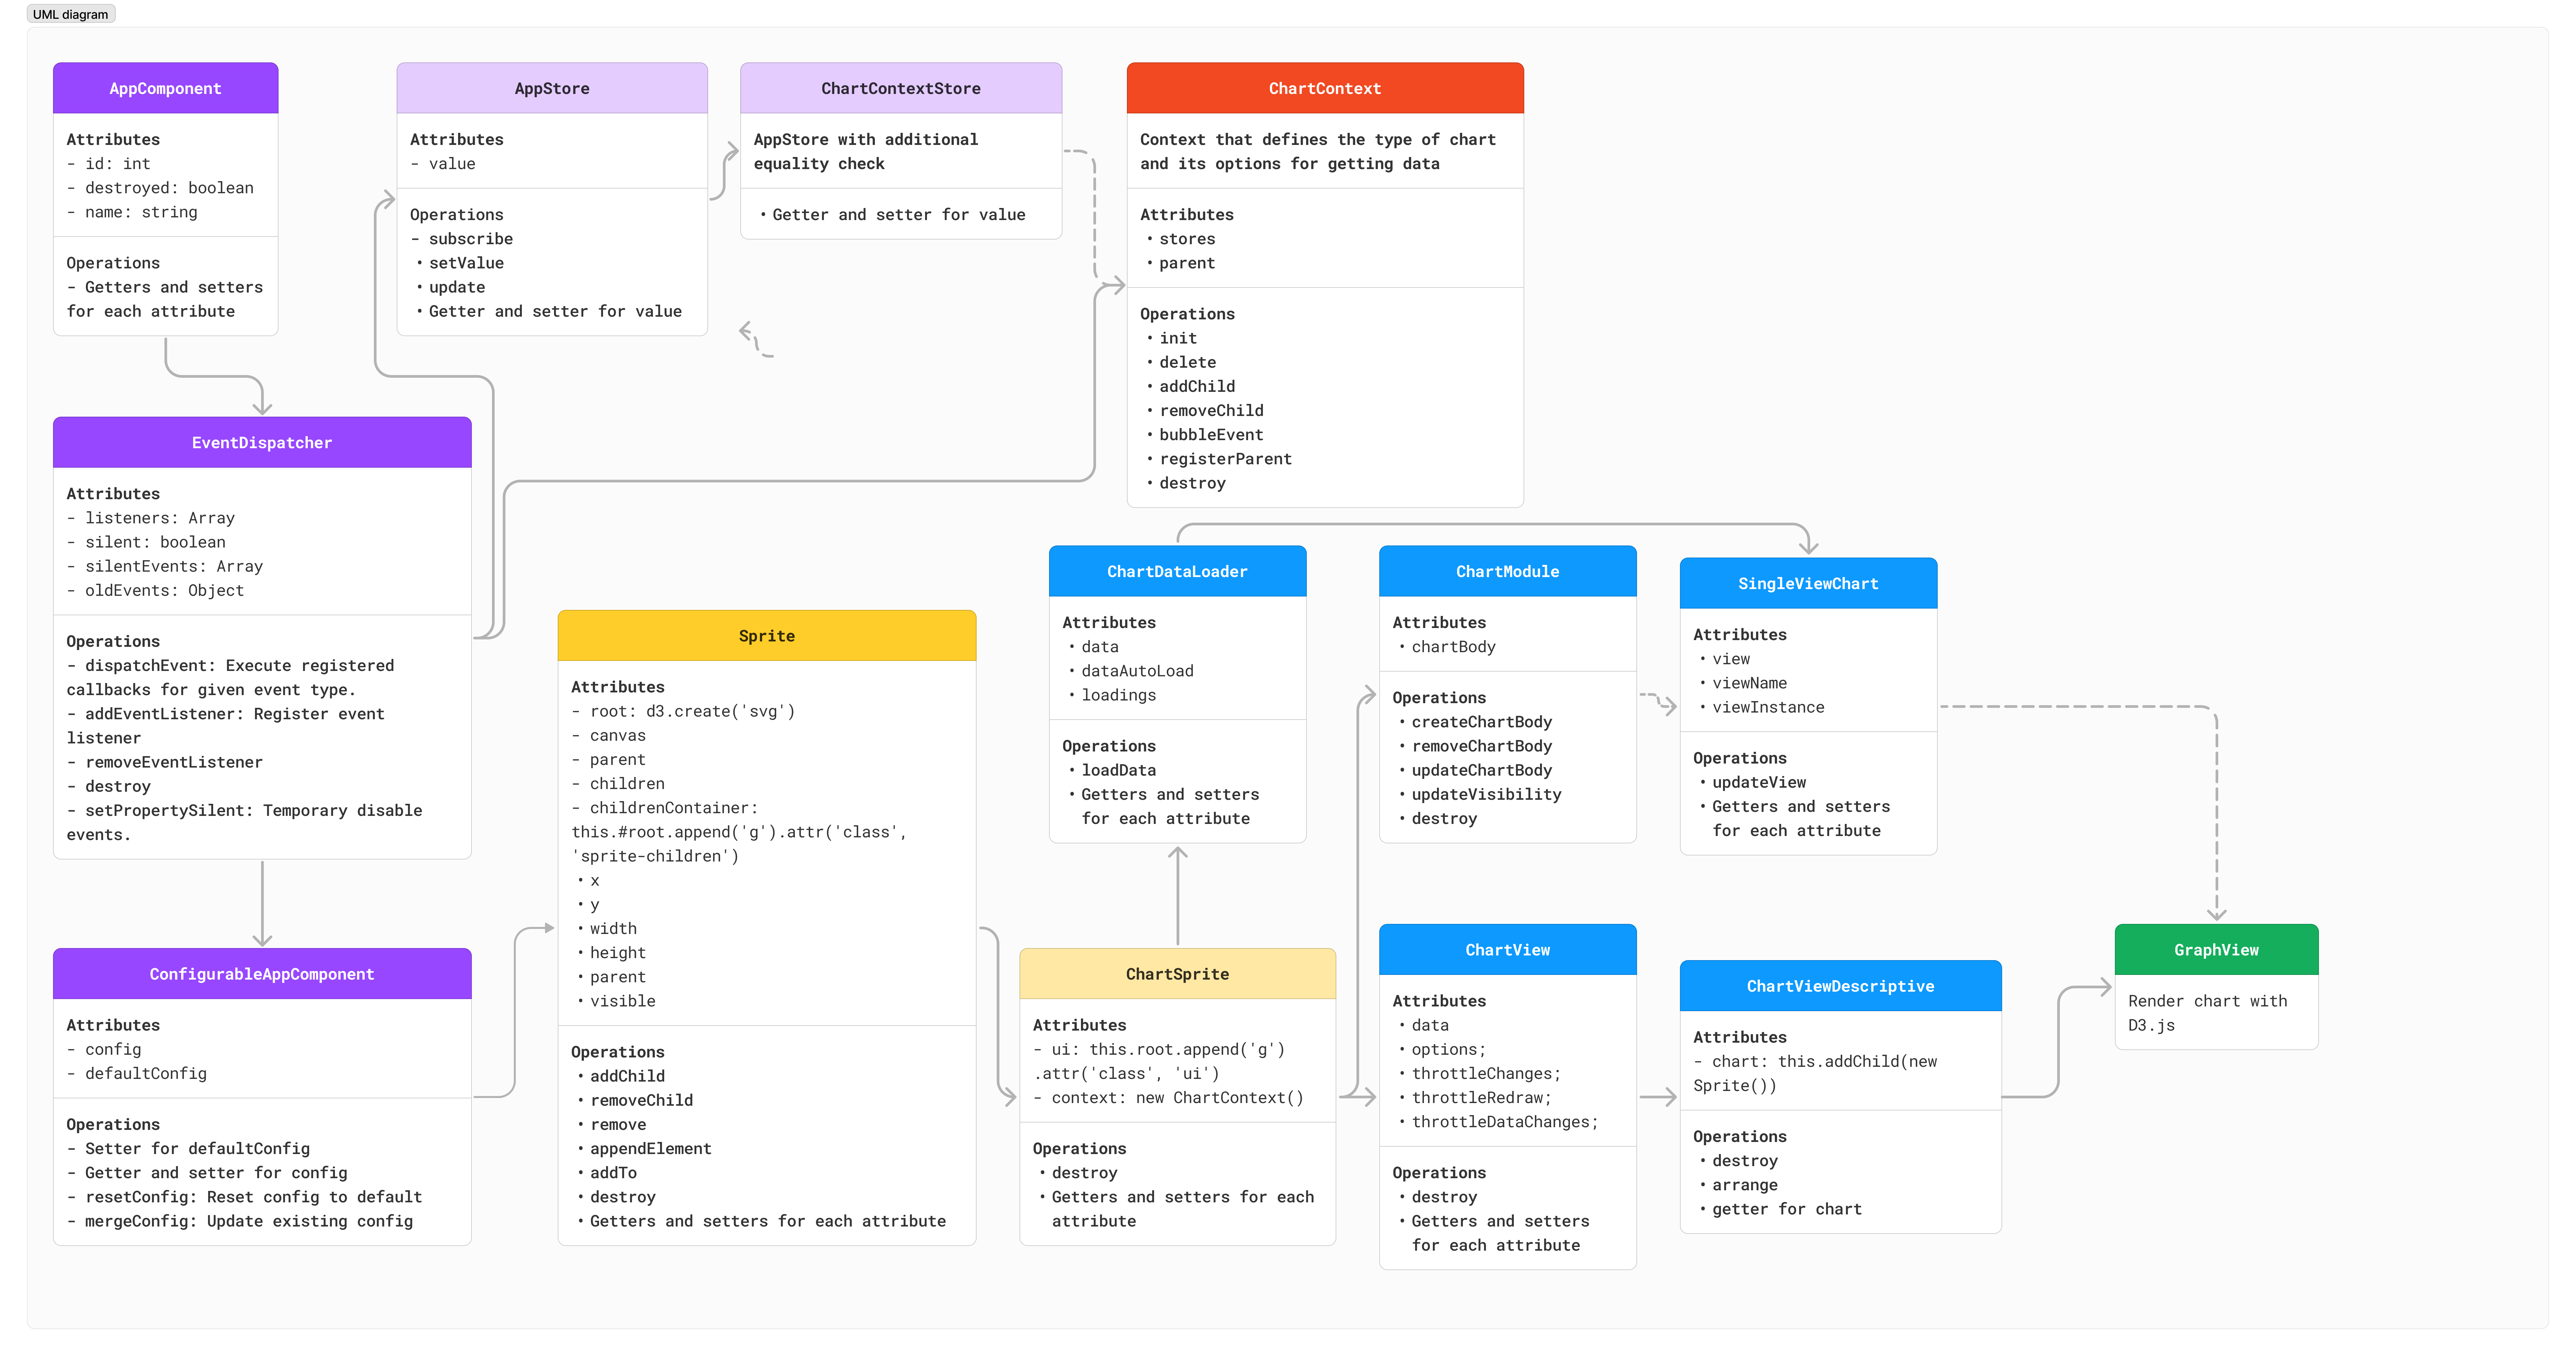
Chart Context
The ChartContext class centralizes the management of chart properties using stores. By initializing stores within the context, it ensures that all state changes are managed consistently and efficiently.
Purpose:
- Manage Charts: Keep track of all the charts, allowing for easy addition, removal, and updates.
- Coordinate Updates: Update configurations and data for all charts from a single place. For example, it sets up and propagate global configurations for all charts, such as default styles or themes.
- Uniform Behavior: Ensure that all charts adhere to certain standards or behaviors.
export default class ChartContext extends EventDispatcher {

	constructor(parent = null, initialValues = {}, initlAll = false) {
		super();

	// Assign default values.
	this.#defaultValues = Object.assign(
		{
			[ChartOption.DATA_FIELD]: DataType.GRAPH,
			[ChartOption.CHART_VIEW]: DataType.GRAPH,
			[ChartOption.CHART_BACKGROUND]: 'transparent',
			[ChartOption.CHART_HEIGHT]: 1000,
		},
		initialValues
	);

	// List of all properties available.
	this.#allProperties = Object.freeze([
		ChartOption.DATA_FIELD,
		ChartOption.CHART_VIEW,
		ChartOption.CHART_BACKGROUND,
		ChartOption.CHART_HEIGHT,
	])

	 ///...initialization of other variables

	this.#stores = this.#allProperties.reduce((acc, curr) => {
			acc[curr] = {
					store: new ChartContextStore(this.#defaultValues[curr]),
					ownValue: initialValues.hasOwnProperty(curr),
			};

			// Freeze always own stores.
			if (this.#alwaysOwnProperties.has(curr)) {
					Object.freeze(acc[curr]);
			}

			return acc;
	}, {});

	//...rest of code...
}
Each property gets its own store, initialized with a default value.
ownValue determines if the store’s value is local to the context or inherited from a parent context.
In the next section, we will see how subscriptions ensure that changes to store values are propagated correctly.
Subscription model
The subscription model is used to manage state changes and communication between different parts of an application. The subscription model involves objects (subscribers) registering interest in specific events or changes to another object (publisher). When the publisher changes, it notifies all subscribed objects, allowing them to react accordingly.
Purpose:
- Event Listening: Subscribers listen for specific events or state changes.
- Decoupling: Reduces direct dependencies between components, making the system more modular.
- Reactivity: Ensures that components automatically update in response to relevant changes.
  subscribe(storeName, handler) {
      // Create object for given store name to store handlers.
      this.#ownSubscribes[storeName] = this.#ownSubscribes[storeName] || new Map();

      // Exit if handler is already assigned to given store. Ensures that the same handler isn’t subscribed multiple times to the same store.
      if (this.#ownSubscribes[storeName].has(handler)) {
          return;
      }

      // Subscribe and store unsubscription function.
      this.#ownSubscribes[storeName].set(handler, this.store(storeName).subscribe(handler));

      // Return unsubscribe function.
      return this.#ownSubscribes[storeName].get(handler);
  }
Detailed breakdown
#ownSubscribes is a private property of the class that stores subscriptions. It is a dictionary where each key is a store name, and the value is another map that holds a handler (callbacks) and its corresponding unsubscription functions.
this.#ownSubscribes[storeName].set(handler, this.store(storeName).subscribe(handler)); The store method retrieves the AppStore instance associated with storeName.
	store(name) {
		return this.#stores[name].store;
}- 1The subscribe method of the AppStore class is called with handler as the argument. This method registers the handler to be called whenever the store's value changes (ie. when the private setValue method gets triggered).
- 2When you assign a new value to the store's value property, it triggers the #setValue function, which then triggers the event listener in the subscribe method. The value setter provides a more intuitive way to update the store's value.
- 3The set method is an alias for the value setter
There is a set method in the Chart Context class that sets the store’s value. This is an alias for this.store(name).set(value).
	/**
	 * Set store value.
	 * Alias for this.store(name).set(value)
	 * @param {string} name - store name.
	 * @param {*} value - value to set.
	 */
	set(name, value) {
		// Clone data field objects if it is registered as own value of this context.
		if (name === ChartOption.DATA_FIELD && Array.isArray(value) && this.itsOwnProperty(name)) {
			this.store(name).set(value.map(ctx => ctx.clone()));
		} else {
			this.store(name).set(value);
		}
	}
Example usage
To set a new CHART_VIEW value
context.value(ChartOption.CHART_VIEW)When a new value is set for the CHART_VIEW property, the callback is triggered because of the subscription
  context.subscribe(ChartOption.CHART_VIEW, () => {
    console.log('action to take when CHART_VIEW values changes')
  })
TIP: Benefits of defining types
- Consistency: Using static properties for event types ensures a single, consistent definition across your codebase, avoiding errors like typos and making the code more reliable.
- Ease of Refactoring: Centralizing event types in a class simplifies refactoring; changing the event type in one place updates it everywhere, reducing the risk of errors.
- Extensibility: Organizing event types in a class allows for easy extension and management as your application grows, ensuring your code remains clean and scalable.
	export default class ChartOption {
		static DATA_FIELD = 'DATA_FIELD';
		static CHART_VIEW = 'CHART_VIEW';
	}
Event Dispatcher
The event dispatcher model is useful in scenarios where different parts of an application need to react to changes or actions occurring elsewhere in the application.
Purpose
- Decoupling: The components don’t need to know about each other directly. The button doesn’t need to know that the logging system exists, only that it should dispatch an event when clicked.
- Flexibility: Multiple listeners can be attached to the same event, allowing for easy extension and modification of behavior without altering existing code.
- Maintainability: Code is easier to maintain because the event handling logic is centralized and follows a consistent pattern.
	dispatchEvent(event, force) {
		if (this.destroyed) {
			console.warn('🗣️ Trying to dispatch events from destroyed dispatcher.', event.type);
		}

		// Set the target and oldValue only if target is not set, otherwise it means that event was originally dispatched from another dispatcher and then forwarded.
		if (!event.target) {
			event.target = this;
			event.oldData = this.#oldEvents[event.type]?.data;
			this.#oldEvents[event.type] = event;
		} else {
			event._bubbled = true;
		}

		// Run callbacks for specific subscribers.
		this.#listeners?.[event.type]?.forEach(callback => callback(event));

		// Run callbacks for general subscribers.
		this.#listeners?.['*']?.forEach(callback => callback(event));
	}

	addEventListener(type, callback) {
		const callbacks = this.#listeners[type] || [];

		if (callbacks.indexOf(callback) === -1) {
			callbacks.push(callback);
			this.#listeners[type] = callbacks;
		}

		// Return function to unsubscribe.
		return function () {
			this.target.removeEventListener(this.type, this.callback);
		}.bind({ type, callback, target: this });
	}
Example usage
To register a callback function that will be called whenever a specific event type, in this example AppStoreEventType.CHANGE, is dispatched
this.addEventListener(AppStoreEventType.CHANGE, ({ data, oldData, target }) => callback(data, oldData, target));The dispatchEvent method is responsible for triggering events and executing the registered callbacks.
this.dispatchEvent(new AppEvent(AppStoreEventType.CHANGE, value))How is it different from the subscription model?
Key Differences:
- Event Dispatcher: Focuses on discrete events and actions. Each event is independent, and the system is more about reacting to occurrences.
- Subscription Model: Focuses on ongoing data or state changes, typically tied to a specific source of truth.
Building the dashboard: Starting point
A new chart context is initialized with the global context settings. This is then passed down to the child components where are a toolbar representing a panel of buttons which causes changes to the charts, and a section consisting of the charts.
<script>
	import DashboardCharts from '../DashboardCharts.svelte';
	import DashboardToolbar from '../DashboardToolbar.svelte';

	import ChartContext from '@/packages/data/ChartContext';

	import { getContext } from '@/packages/data/stores/trending';

	const context = getContext(ChartContext.GLOBAL);

	// Create page-specific context
	const pageRootContext = new ChartContext(context);
</script>

<DashboardToolbar context={pageRootContext} />
<DashboardCharts context={pageRootContext} />
Some of the code snippets below have been truncated for brevity. You can view the full code for each class by clicking on the arrow beside each header title. Hover over a bullet point to locate the relevant lines of code within the code block.
DashboardCharts component
- 1A new chart context is initialized with the parent context. This is meant to localize the context to the component.
- 2A new ChartModule instance is initialized, which displays a chart based on the chart context.
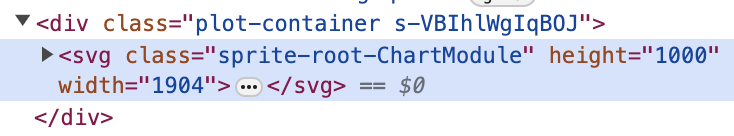
- 3The chart's root element is added to the targetEl in the DOM.
- 4The div with the class plot-container is bound to the targetEl variable using Svelte's bind:this directive. It is the spot on the UI where the chart will appear, and `bind:this={targetEl}` is a way to remember this spot so we can use it in our code.
- 5The purpose of linking the chart instance's context to the local context, is to ensure that the chart instance has access to all necessary data and configuration settings contained within localContext.
- 6The local context and plot instance is destroyed when the component is destroyed and thus break all connections with the component that we no longer need.
ChartModule class
Displays a chart body based on the chart context. SingleViewChart means there is only one layer of a chart type, such as a line, representing only one data property. Another class such as MultipleViewsChart can be created to display a multiple line chart or a layer of one line over a scatter plot. This dashboard will only be rendering a network visualization for now, so only the SingleViewChart class is utilized.
- 1When CHART_VIEW is assigned an initial value, a function to create a chart body is called
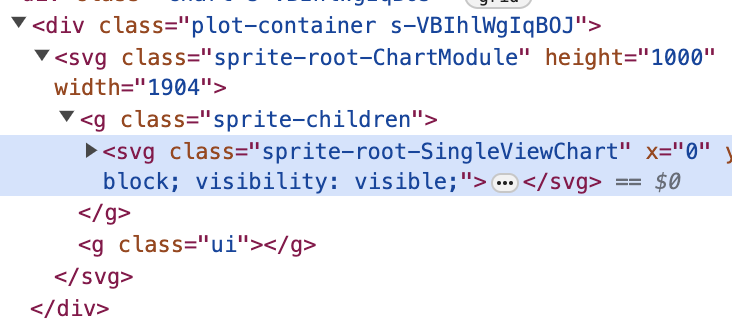
- 2Another class called SingleViewChart is initialized, and returns an svg element representing the created chart body.`
- 3Adds the newly created SingleViewChart instance as a child to the current object. addChild is a function in the parent Sprite class that will add the chart body to the DOM, nested within the div called 'plot-container'.
SingleViewChart class
This creates a view to display data for only one property.
- 1When there is a new CHART_VIEW value, such as either Line or Graph, #view is set, removing the existing view and adding a new one.
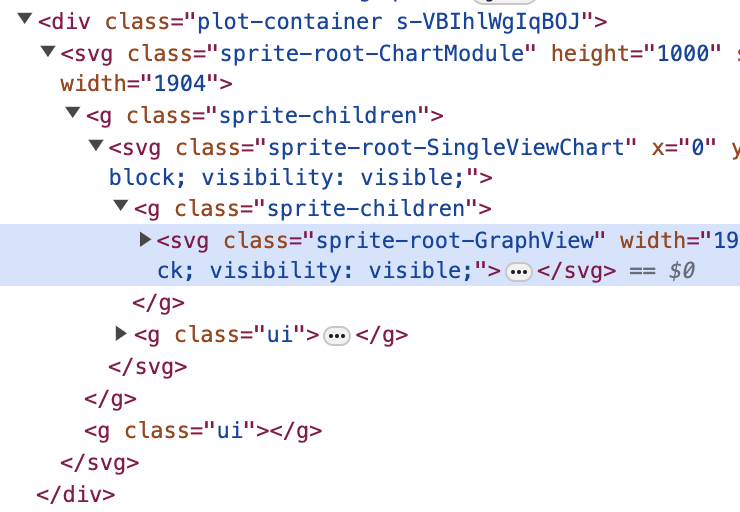
- 2A new specified view is initialized with `new chartViews[value]`. For example a Line or Graph view is initialized. #viewInstance represents the newly created svg element, which it is added to the DOM as a child of the svg element representing the chart body
- 3When any of the chart's configuration parameter such as data, width or height changes individually, the view is updated
TIP: Create a store to list all chart view types, so it can be extended in the future easily, if there has to be more chart types. For example,
new chartViews['GRAPH']()will initializeGraphViewclass.
	import ChartViewType from '@/packages/charts/types/ChartViewType';
	import GraphView from '@/packages/charts/views/graph/GraphView';

	export default Object.freeze({
		[ChartViewType.GRAPH]: GraphView,
		[ChartViewType.LINE]: LineView,
	});
ChartDataLoader class loads chart data automatically based on options specified and renders a loader while waiting for data to finish loading.
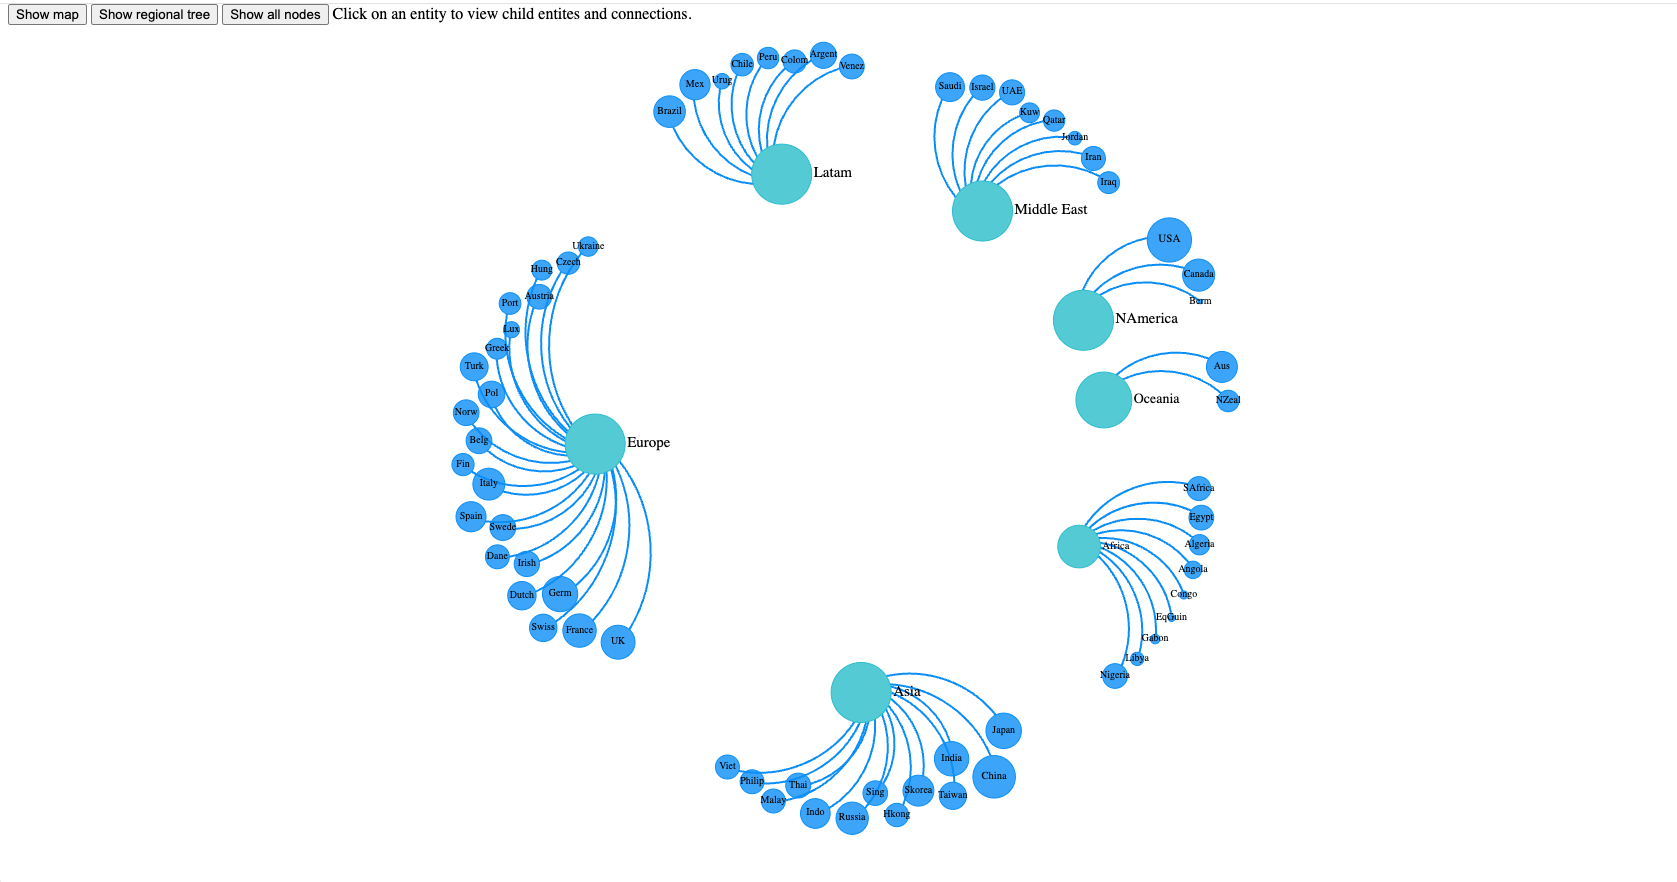
Graph View
Now that we have walked through the main structure of the dashboard, let’s look at the internals of a chart type, such as the Graph View, which follows a different lineage of classes. You will see how a view is made up of layers after layers of classes, each serving a specific purpose, with the core being the AppComponent class.
GraphView contains all the code necessary to render a network visualization. It is a child class of ChartViewDescriptive, which in turn is a child of ChartView class.
	export default class GraphView extends ChartViewDescriptive {
		// all the code to render and dynamically update a network visualization goes below
		constructor() {
			super();

			this.mergeConfig(defaultConfig);

			const g = this.chart.childrenContainer.append("g");

			this.addEventListener(AppEventType.REDRAW_CHART, () => {
				this.redraw();
			});
		}

		redraw() {
		}
	}
ChartViewDescriptive is used to create the chart container, and also render and position additional or miscelleneous chart-related elements such as a legend.
	export default class ChartViewDescriptive extends ChartView {
		constructor() {
			super();

			this.mergeConfig(defaultConfig);

			// Chart container.
			this.#chart = this.addChild(new Sprite());
		}

		get chart() {
			return this.#chart;
		}
	}
ChartView represents the visual part of chart. It is where properties such as the color, x and y scale of a chart is initialized, with setter and getter functions for each property. It also where request to redraw everything within a chart container is dispatched.
ChartSprite is the sprite to be used specifically for charts. An svg group is created to contain interfaces elements over the chart, such as a loading spinner.
export default class ChartSprite extends Sprite {
    #ui
    #context

    constructor () {
        super()

        this.#ui = this.root.append('g').attr('class', 'ui');
        this.#context = new ChartContext();

    }

    get ui () {
        return this.#ui
    }

    get context () {
        return this.#context
    }

    destroy () {
        super.destroy()
        this.#context.destroy()
    }
}
Sprite is a basic class used to create graphics instance. It is essentially a chart’s root.
One of the main responsbilities of the ConfigurableAppComponent is to make all sprites’ children be aware of configuration changes through disaptching an event when any change to the configuration happens. It also contains other helper functions to handle the configuration.
AppComponent is the core. It is the base for all classes in the app, where the id and name of the instance is set.
Conclusion
In this article, we’ve explored the design and implementation of a data dashboard using Object-Oriented Programming (OOP) principles. By structuring our dashboard around key classes such as SingleViewChart and ChartContext, we’ve been able to create a system that is both modular and maintainable. The OOP design pattern addressing the challenge of managing communication between components.
I first created the same network visualization dashboard in functional programming approach and quickly realized it was difficult to manage and maintain it because of the complexity in state management and handling side effects. As the dashboard grew, the tightly coupled code made it hard to isolate and modify specific parts without affecting others.
Though there seems to be more overhead in setting up the OOP architecture, this OOP-based design lays the groundwork for future enhancements, such as adding new visualization types or more interactivity to the user interface. I feel that the flexibility of the current architecture means that these changes can be implemented with minimal disruption to the existing codebase.
In conclusion, adopting OOP principles for building a data dashboard has proven to be a robust approach, offering both immediate benefits and long-term viability. As you embark on your own projects, consider how OOP can help you manage complexity and build flexible and extensible user interfaces.